项目概述
构建实时数据监控仪表盘:
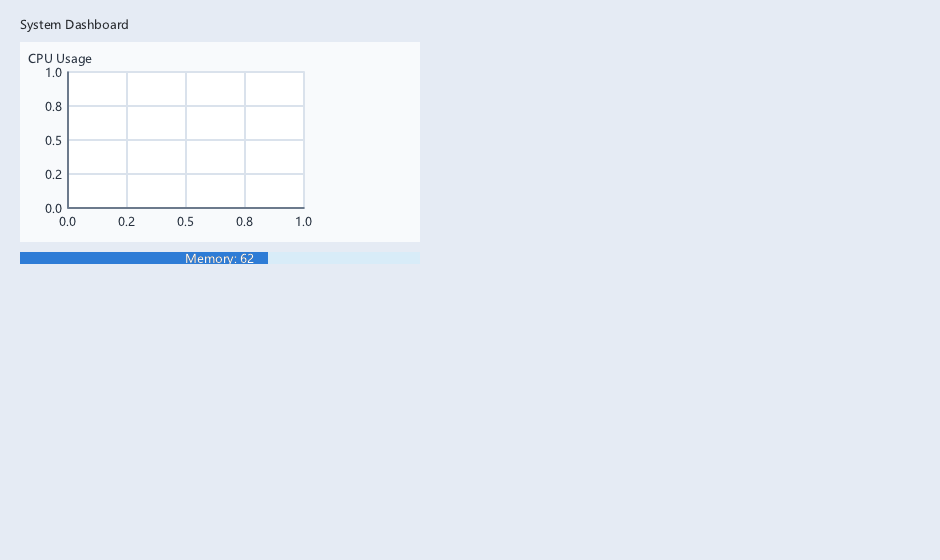
• 折线图:Chart 显示 CPU/内存/网络实时曲线
• 数据表格:TableGrid 展示进程/服务列表
• 属性面板:PropertyGrid 显示选中项详情
• 饼图:磁盘/内存占比
• 自动刷新:定时器轮询数据源
技术栈
| 模块 | XUI API |
|---|---|
折线图 | xuiChartCreate(LINE 模式) |
饼图 | xuiChartCreate(PIE 模式) |
数据网格 | xuiTableGridCreate(排序/筛选) |
属性 | xuiPropertyGridCreate(只读分类) |
布局 | DockPanel + ScrollView |
编译本章示例
gcc -O2 -I. -o ch205.exe ch205_main.c src\xui_*.c build\xge.lib -lm -lws2_32 -liphlpapi -lgdi32 -luser32 -lshell32 -lopengl32 -lole32 -lwinmm -lavrt
.\ch205.exe
核心代码:实时折线图
// 创建 CPU 使用率折线图
xui_chart_desc_t tChartDesc = { 0 };
tChartDesc.iType = XUI_CHART_SERIES_LINE;
tChartDesc.iMaxPoints = 60;  // 60 秒窗口

xui_widget pChart;
xuiChartCreate(pCtx, &pChart, &tChartDesc);

// 定时器每秒更新
void OnTimer(void) {
    float fCPU = GetCpuUsage();
    float fMem = GetMemUsage();

    /* 滚动窗口采样后整体提交序列数据 */
    xuiChartSetSeriesData(pChart, 0, tCpuPts, iCount);
    xuiChartSetSeriesData(pChart, 1, tMemPts, iCount);

    // 更新表格当前行
    /* TableGrid 数据经适配器更新(xuiTableGridSetAdapter) */
}

// 饼图:磁盘分区占比
xui_chart_desc_t tPieDesc = { 0 };
tPieDesc.iType = XUI_CHART_SERIES_PIE;
xui_widget pPie;
xuiChartCreate(pCtx, &pPie, &tPieDesc);
xuiChartAddSeries(pPie, XUI_CHART_SERIES_PIE, "C:", &iIdx);;
xuiChartAddSeries(pPie, XUI_CHART_SERIES_PIE, "D:", &iIdx);
完整代码
将以下代码保存为 ch205_main.c,编译后运行即可看到实时折线图监控面板效果:
#include "xge.h"
#include "xui.h"

static xui_context g_pCtx;
static xui_widget g_pChart;
static float g_fTimer = 0.0f;
static float g_fVal = 50.0f;

static int onFrame(void* pUser) {
    (void)pUser;
    float dt = xgeGetDelta();
    xgeClear(0x1a1a2e);

    /* 每秒添加一个数据点 */
    g_fTimer += dt;
    if (g_fTimer >= 1.0f) {
        g_fTimer -= 1.0f;
        g_fVal += (xgeGetDelta() * 1000.0f) - 8.0f;
        if (g_fVal < 0) g_fVal = 0;
        if (g_fVal > 100) g_fVal = 100;
        xuiChartSetSeriesData(g_pChart, 0, tPts, iCount);  /* 滚动窗口 */
    }

    xui_vec2_t pos;
    xgeMouseGet(&pos.x, &pos.y);
    xuiInputPointerMove(g_pCtx, pos.x, pos.y);
    if (xgeMouseDown(XGE_MOUSE_LEFT))
        xuiInputPointerDown(g_pCtx, pos.x, pos.y, 0);
    else
        xuiInputPointerUp(g_pCtx, pos.x, pos.y, 0);
    xuiUpdate(g_pCtx, dt);
    xuiLayout(g_pCtx);
    xuiRender(g_pCtx, NULL, NULL, 0);
    return XGE_OK;
}

int main(void) {
    xge_desc_t d = {0};
    d.iWidth = 800; d.iHeight = 500;
    d.sTitle = "ch205 - System Monitor";
    d.iFlags = XGE_INIT_VSYNC;
    xgeInit(&d);
    xuiCreate(&g_pCtx);
    extern const xui_proxy_t tXgeProxy;
    xui_proxy_t tXgeProxy = xuiProxyXge();
xuiSetProxy(g_pCtx, &tXgeProxy);
    xuiSetViewportSize(g_pCtx, 800, 500);

    xui_widget pRoot;
xuiPanelCreate(g_pCtx, &pRoot, NULL);
    xuiWidgetSetRect(pRoot, (xui_rect_t){0, 0, 800, 500});

    xui_chart_desc_t tCD = {0};
    tCD.iType = XUI_CHART_SERIES_LINE;
    tCD.iMaxPoints = 60;
    xuiChartCreate(g_pCtx, &g_pChart, &tCD);
    xuiWidgetSetRect(g_pChart, (xui_rect_t){40, 40, 720, 400});
    xuiWidgetSetRect(g_pChart, (xui_rect_t){0, 0, 720, 400});

    xgeRun(onFrame, NULL);
    xuiDestroy(g_pCtx);
    xgeUnit();
    return 0;
}
代码讲解
- Chart LINE:创建折线图控件,保留最近 60 个数据点(60 秒窗口)。
- 定时更新:帧循环中累计时间,每秒添加一个数据点,1Hz 刷新足够。
- 数据窗口:超过 iMaxPoints 后旧点自动移除,图表滚动显示。
- 联动:实际项目中可配合 TableGrid/PropertyGrid 显示进程详情。
要点与陷阱
- 刷新频率:1Hz 足够,避免高频更新导致 UI 卡顿。
- 数据窗口:折线图保留最近 N 点,旧点自动移除。
- 虚拟化:TableGrid 万行数据启用虚拟化。
- 联动:点击表格行 → PropertyGrid 显示详情。
进阶练习
- 告警:CPU > 90% 时 Toast 警告 + 折线变红。
- 导出:Chart 数据导出为 CSV 文件。